¶ Introduction
This article will serve as the how-to guide for installing and running the Wyebot exporter which is an easy way to get started with API integration.
The Wyebot exporter is a self-hosted service that connects to the DEX sensor dashboard and hosts an HTTP page with metrics in a Prometheus compatible format. Many tools can directly ingest this format including Splunk, Datadog, and Victoria Metrics.
The instructions will walk you through running the exporter with Docker CLI but other container hosts like Podman or Rancher run it as well.
¶ Helpful Links
- Available MetricsAll metics and labels included with the exporter
- Grafana GuideInstructions and examples of using Wyebot with Grafana
¶ Prerequisites
In order to make use of the Wyebot Prometheus Exporter, you will need to have access to a server (or servers) with the following software installed and running. There are many resources online with guides to install the following. We will link to official documentation.
- Docker https://docs.docker.com/engine/install/
- Prometheus (typically hosted in Docker) https://prometheus.io/docs/prometheus/latest/installation/
¶ Instructions
¶ Generate Wyebot API key
- Login to your Wyebot dashboard with an Admin account.
- Navigate to Management > API
- Click Generate API Key.
- Select a user account and add optional notes. Click Generate.
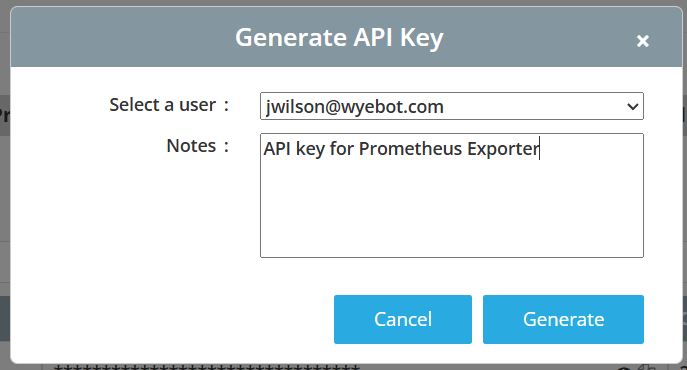
- Copy the API key. We will need it in later steps.
¶ Install the Wyebot Prometheus Exporter
- Login to your server that is acting as the Docker host.
- Replace the
CLOUD_NAMEvariable with your Wyebot dashboard URL prefix. To find this, log into your Wyebot sensors dashboard and note the text afterhttps://and before.wyebot.com. For example with https://wip2.wyebot.com/index.html, theCLOUD_NAMEwould bewip2. - Replace the
API_KEYvariable with the API key you copied in the previous section.
The container is configured to listen on port 8014. If both containers are on the same machine, you may not need to forward it.
Docker run example:
docker run -d \
  --name wyebot-exporter \
  -p 8014:8014 \
  -e CLOUD_NAME="cloud" \
  -e API_KEY="your-api-key" \
  wyebotexporter/prometheus:latest
Docker compose example:
services:
  wyebot-exporter:
    image: wyebotexporter/prometheus:latest
    container_name: wyebot-exporter
    restart: unless-stopped
    ports:
      - "8014:8014" # Useful for testing
    environment:
      - CLOUD_NAME=cloud
      - API_KEY=your-api-key
¶ Configure Prometheus to scrape the exporter
The recommended scrape inverval is 5 minutes since that is the frequency of data updates from the dashboard.
- Create or edit your
prometheus.ymlconfiguration file to add a new job with ascrape_intervalset to5m. - Adjust the targets to point at the IP address/hostname and port of the exporter container.
- Restart your Prometheus server so it accepts the new configuration.
Example prometheus.yml config assuming both containers are on the same machine:
scrape_configs:
  - job_name: 'wyebot'
    scrape_interval: 5m
    scrape_timeout: 5m
    static_configs:
    - targets: ['wyebot-exporter:8014'] # Change the IP/port as needed
¶ Confirm the exporter is working
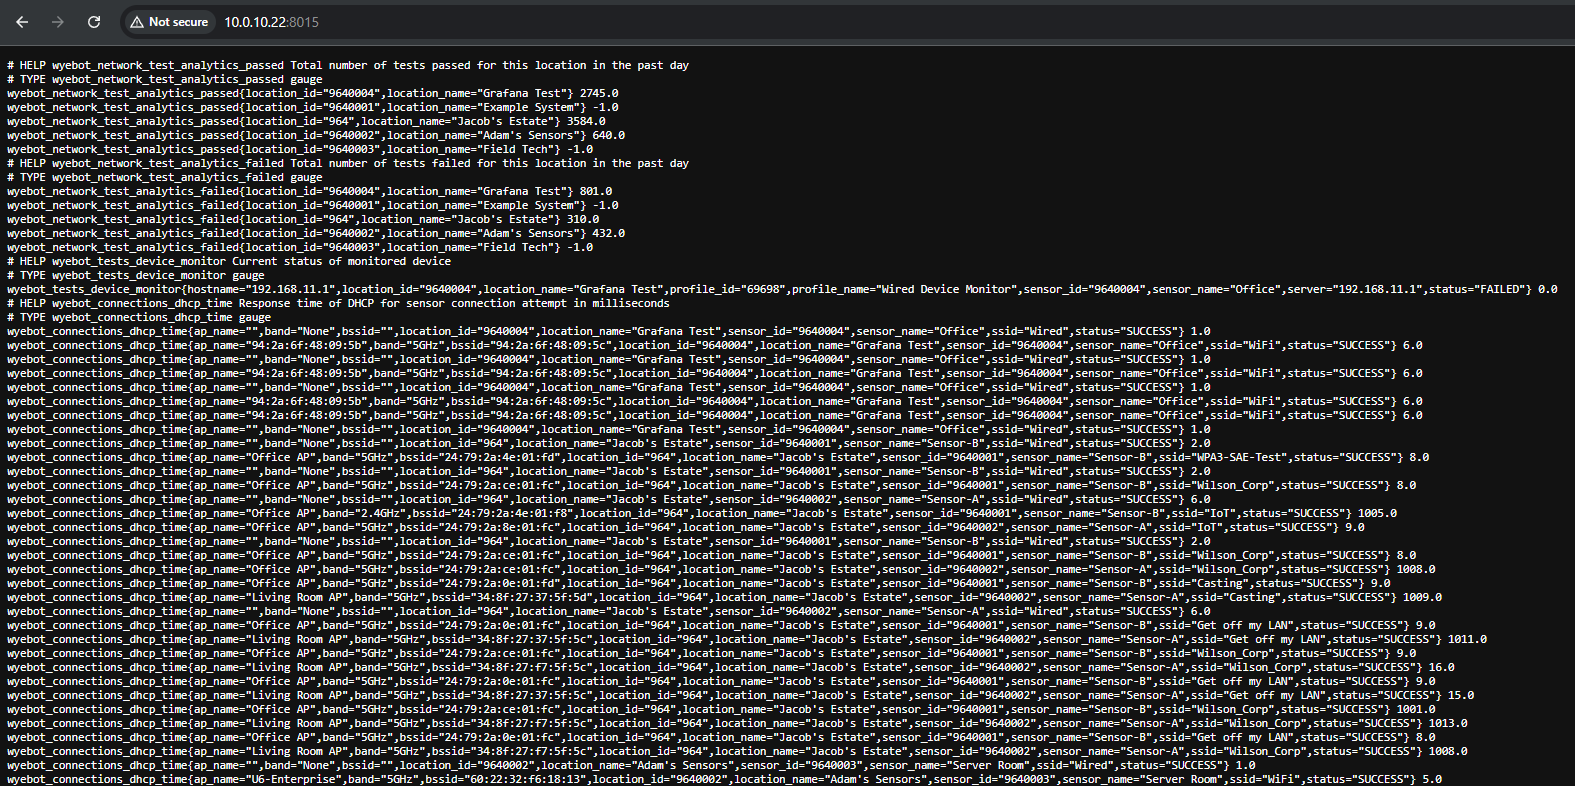
- Check if metrics are being collected by opening a web browser and going to the endpoint where you are running the Wyebot exporter. For example, if you installed it on your local machine at the default port 8014, you can go to http://localhost:8014 or
http://[IP of your exporter]:8014. Once the page loads, you should see a bunch of text, similar to below:
The webpage may take a while to load, since it does all the API calls at the time the webpage is accessed. Please be patient and do not refresh while it is loading.
- If you are using Prometheus, log into your server's web interface. On the top of the UI, select the Status dropdown, then Targets. You should see your Wyebot exporter listed. If it is working the state will say UP. This may take up to 5-10 minutes after you first start the container.

¶ Example config.yml
# Example config.yml

# Network settings
exporter_host: 0.0.0.0    # Address to listen on (default: 127.0.0.1)
exporter_port: 8014       # Port to listen on (default: 8014)

# Cloud/API credentials
# CHANGEME: set below or via ENV variables CLOUD_NAME / API_KEY
cloud_name: cloud_name
api_key: abcdefghijklmnopqrstuvwxyz

# Performance
thread_count: 4           # Number of worker threads used to process jobs concurrently

# Timestamp behavior
# When True, metrics use the timestamp from the network test itself rather than
# scrape time. Useful for backfilling accurate historical data.
# NOTE: requires Prometheus to allow timestamps older than 5 minutes
# ENV: PRECISE_TIMESTAMPS
precise_timestamps: False

# DHCP info (added in v0.1.8)
# When True, includes the sensor's local DHCP-assigned info (e.g. IP) as labels.
# NOTE: each unique IP creates a new time series entry, so this can inflate
# cardinality if the sensor's IP changes often
# ENV: DETAILED_DHCP
detailed_dhcp: False

# Logging
# One of: DEBUG, INFO, WARNING, ERROR, CRITICAL
log_level: INFO

# Syslog
# Forwards exporter logs to a remote syslog server
syslog:
  enabled: false
  host: your-server-here
  port: 514
  protocol: UDP  # UDP or TCP