¶ Introduction
This article will serve as a how-to guide for using installing Grafana along side the Wyebot Prometheus Exporter for a full stack observability setup.
Grafana is an open source solution for making extremely customizable dashboards and alerting from many types of data including Prometheus which makes it a perfect tool to pair with the Wyebot Exporter.
¶ Helpful Links
- Webinar WalkthroughVideo introduction of using the Wyebot Exporter with Grafana
- Wyebot Exporter SetupGuide on how to get started with the Wyebot Exporter
¶ Prerequisites
This guide is assuming you will using the Wyebot Exporter with Prometheus in Docker. A full docker compose example is included but make sure you get your API_KEY and CLOUD_NAME from the Wyebot dashboard.
Official documentation for each component:
- Docker https://docs.docker.com/engine/install/
- Prometheus https://prometheus.io/docs/prometheus/latest/installation/
- Grafana https://grafana.com/docs/grafana/latest/setup-grafana/installation/
¶ Instructions
- Login to your server that is acting as the Docker host.
- Create a file called
prometheus.ymlin the directory you plan to use.
Example prometheus.yml:
scrape_configs:
  - job_name: 'wyebot'
    scrape_interval: 5m
    scrape_timeout: 5m
    static_configs:
    - targets: ['wyebot-exporter:8014'] # This should work with the example docker compose included here but adjust as needed.
- Create a file called
docker-compose.ymlin the same directory, replacing theCLOUD_NAMEvariable with your Wyebot dashboard URL prefix. To find this, log into your Wyebot sensors dashboard and note the text afterhttps://and before.wyebot.com. For example with https://wip2.wyebot.com/index.html, theCLOUD_NAMEwould bewip2.
This is intended to be used as a basic, working example to start using the Wyebot exporter. More cutomization is recommended for production.
Example docker-compose.yml:
services:
  # Wyebot exporter for collecting the data
  wyebot-exporter:
    image: wyebotexporter/prometheus:latest
    container_name: wyebot-exporter
    restart: unless-stopped
    environment:
      - API_KEY=your_api_key_here  # Replace with your actual API key
      - CLOUD_NAME=your_cloud_name_here  # Replace with your cloud name (e.g., CLOUD_NAME=wip4)
    ports:
      - "8014:8014" # Not required but helpful for testing the server

  # Prometheus for storing the data
  prometheus:
    image: prom/prometheus:latest
    container_name: prometheus
    restart: unless-stopped
    ports:
      - "9090:9090" # Not required but helpful for testing the server
    volumes:
      - ./prometheus.yml:/etc/prometheus/prometheus.yml
      - prometheus-data:/prometheus

  # Grafana for graphing the data
  grafana:
    image: grafana/grafana:latest
    container_name: grafana
    restart: unless-stopped
    ports:
      - "3000:3000"
    volumes:
      - grafana-data:/var/lib/grafana

volumes:
  grafana-data:
  prometheus-data:
- Run
docker compose upordocker compose up -dto run in the background. - Log into the newly created Grafana server (
http://your-ip:3000) and navigate to the Connections > Add a New Connection Page. - Select Prometheus in the list and then click Add new data source in the top right.
- Set the data source and IP address/port as shown in the example. You may need to adjust this if you are not using the
docker-compose.ymlexample.
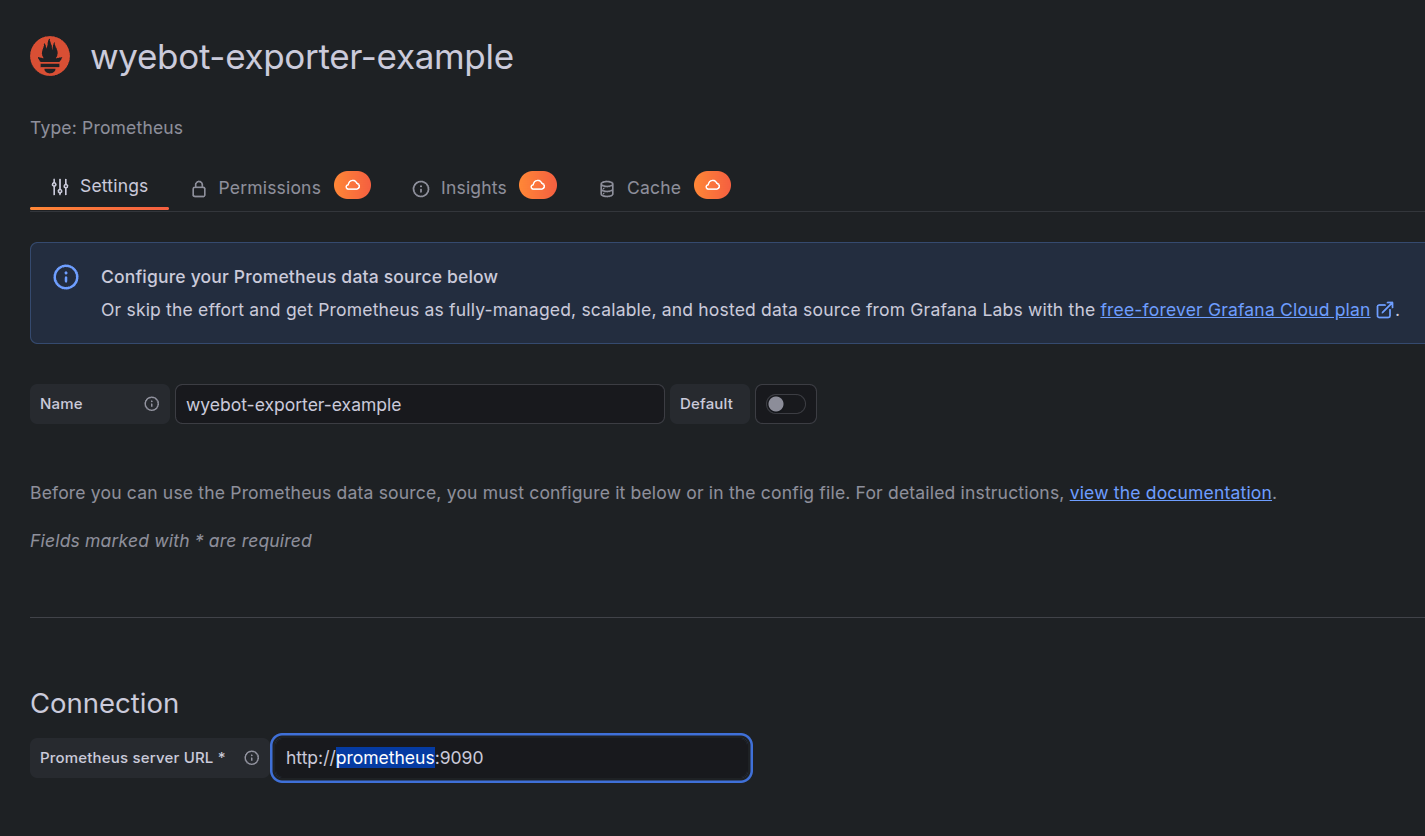
- Click Save & test at the bottom and you should see a green message confirming connectivity.
- Have fun making custom dashboards or import some examples from below.
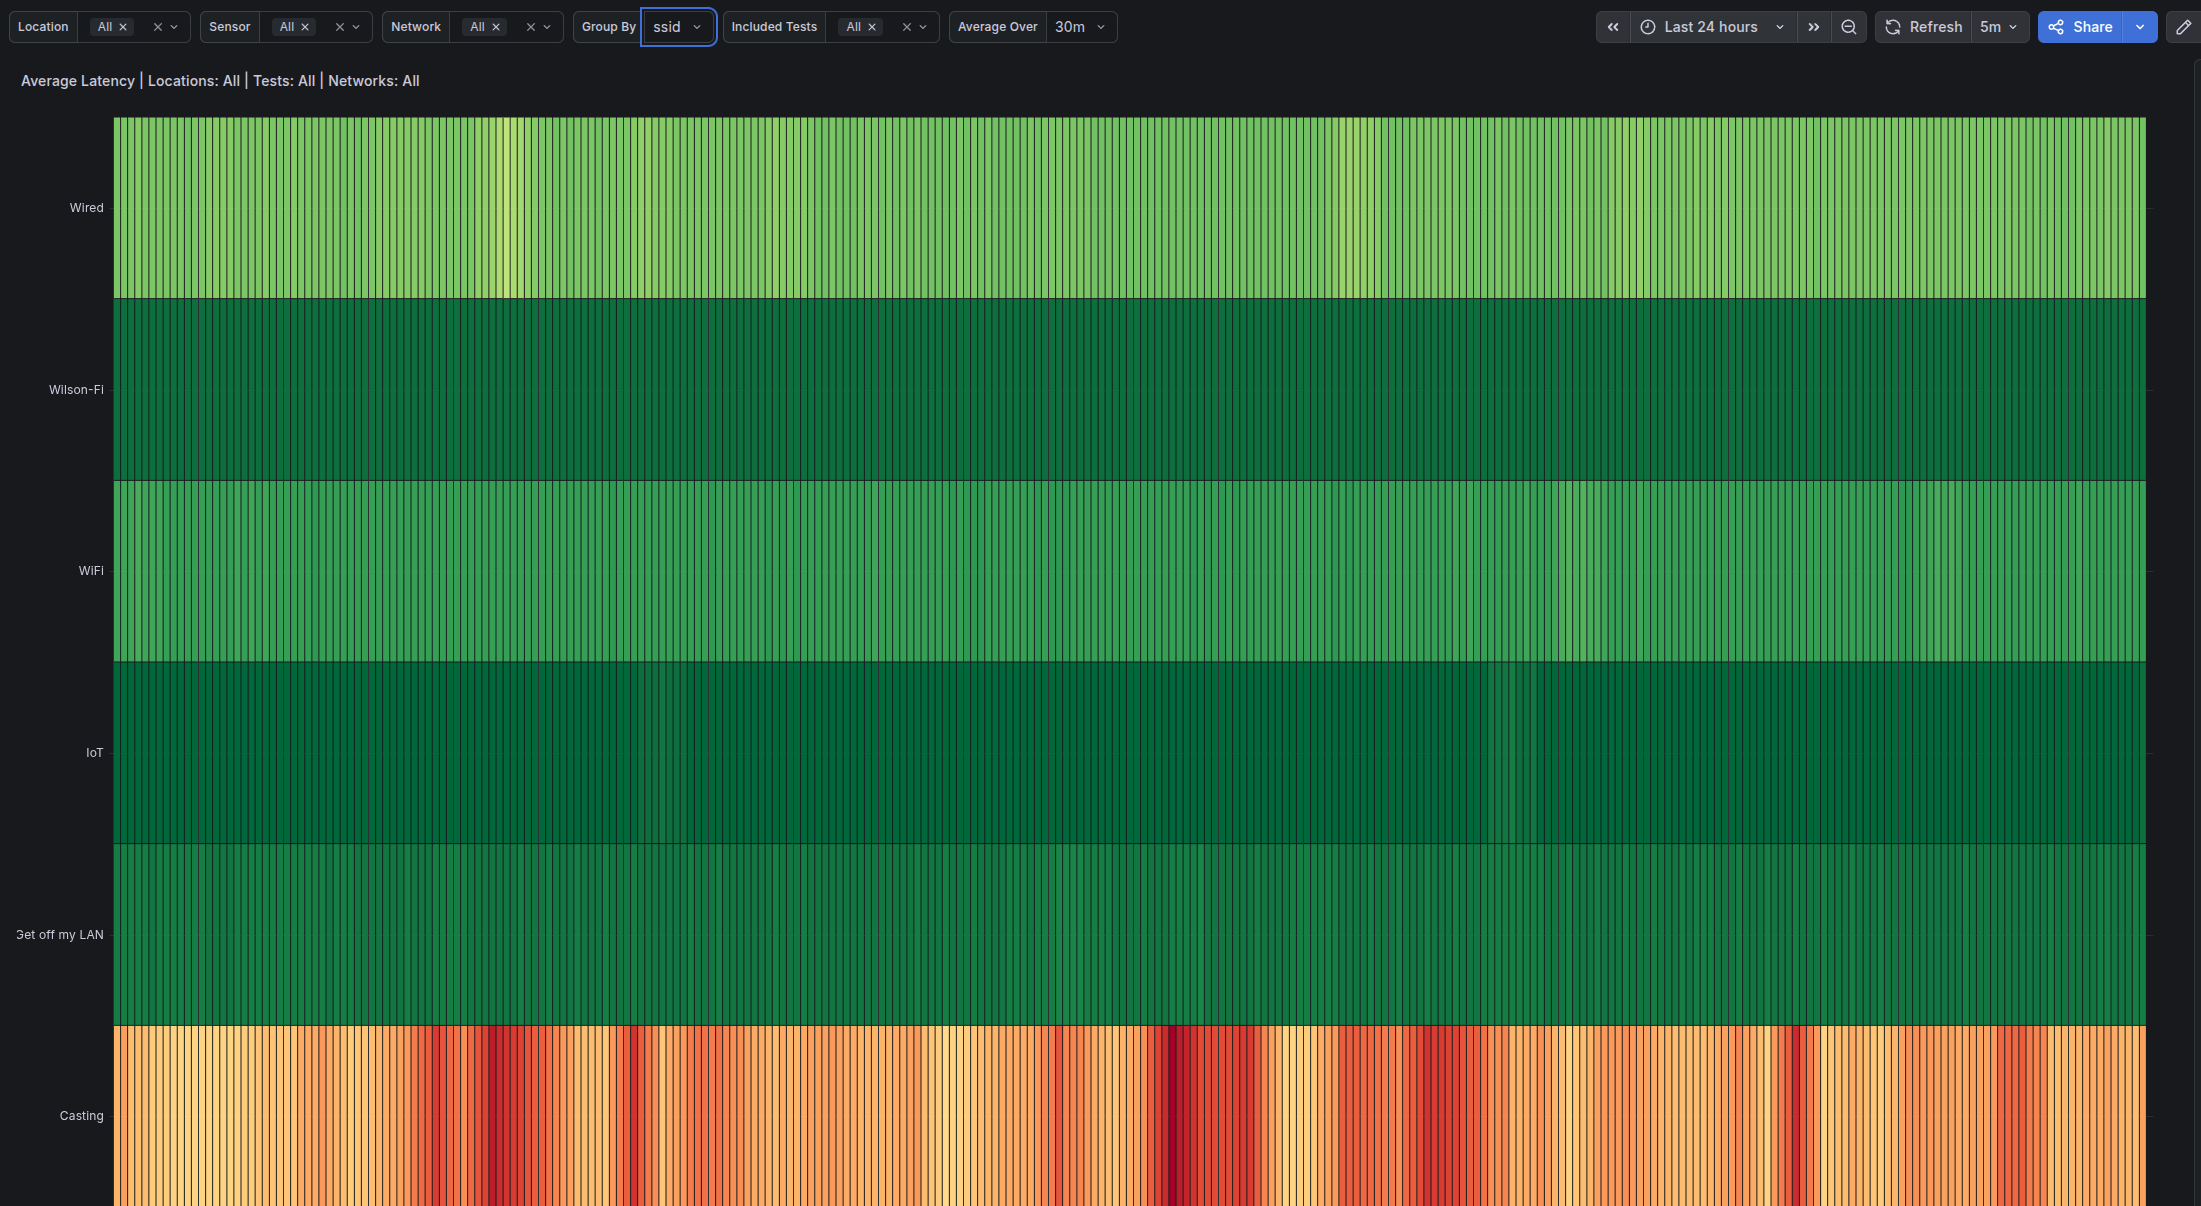
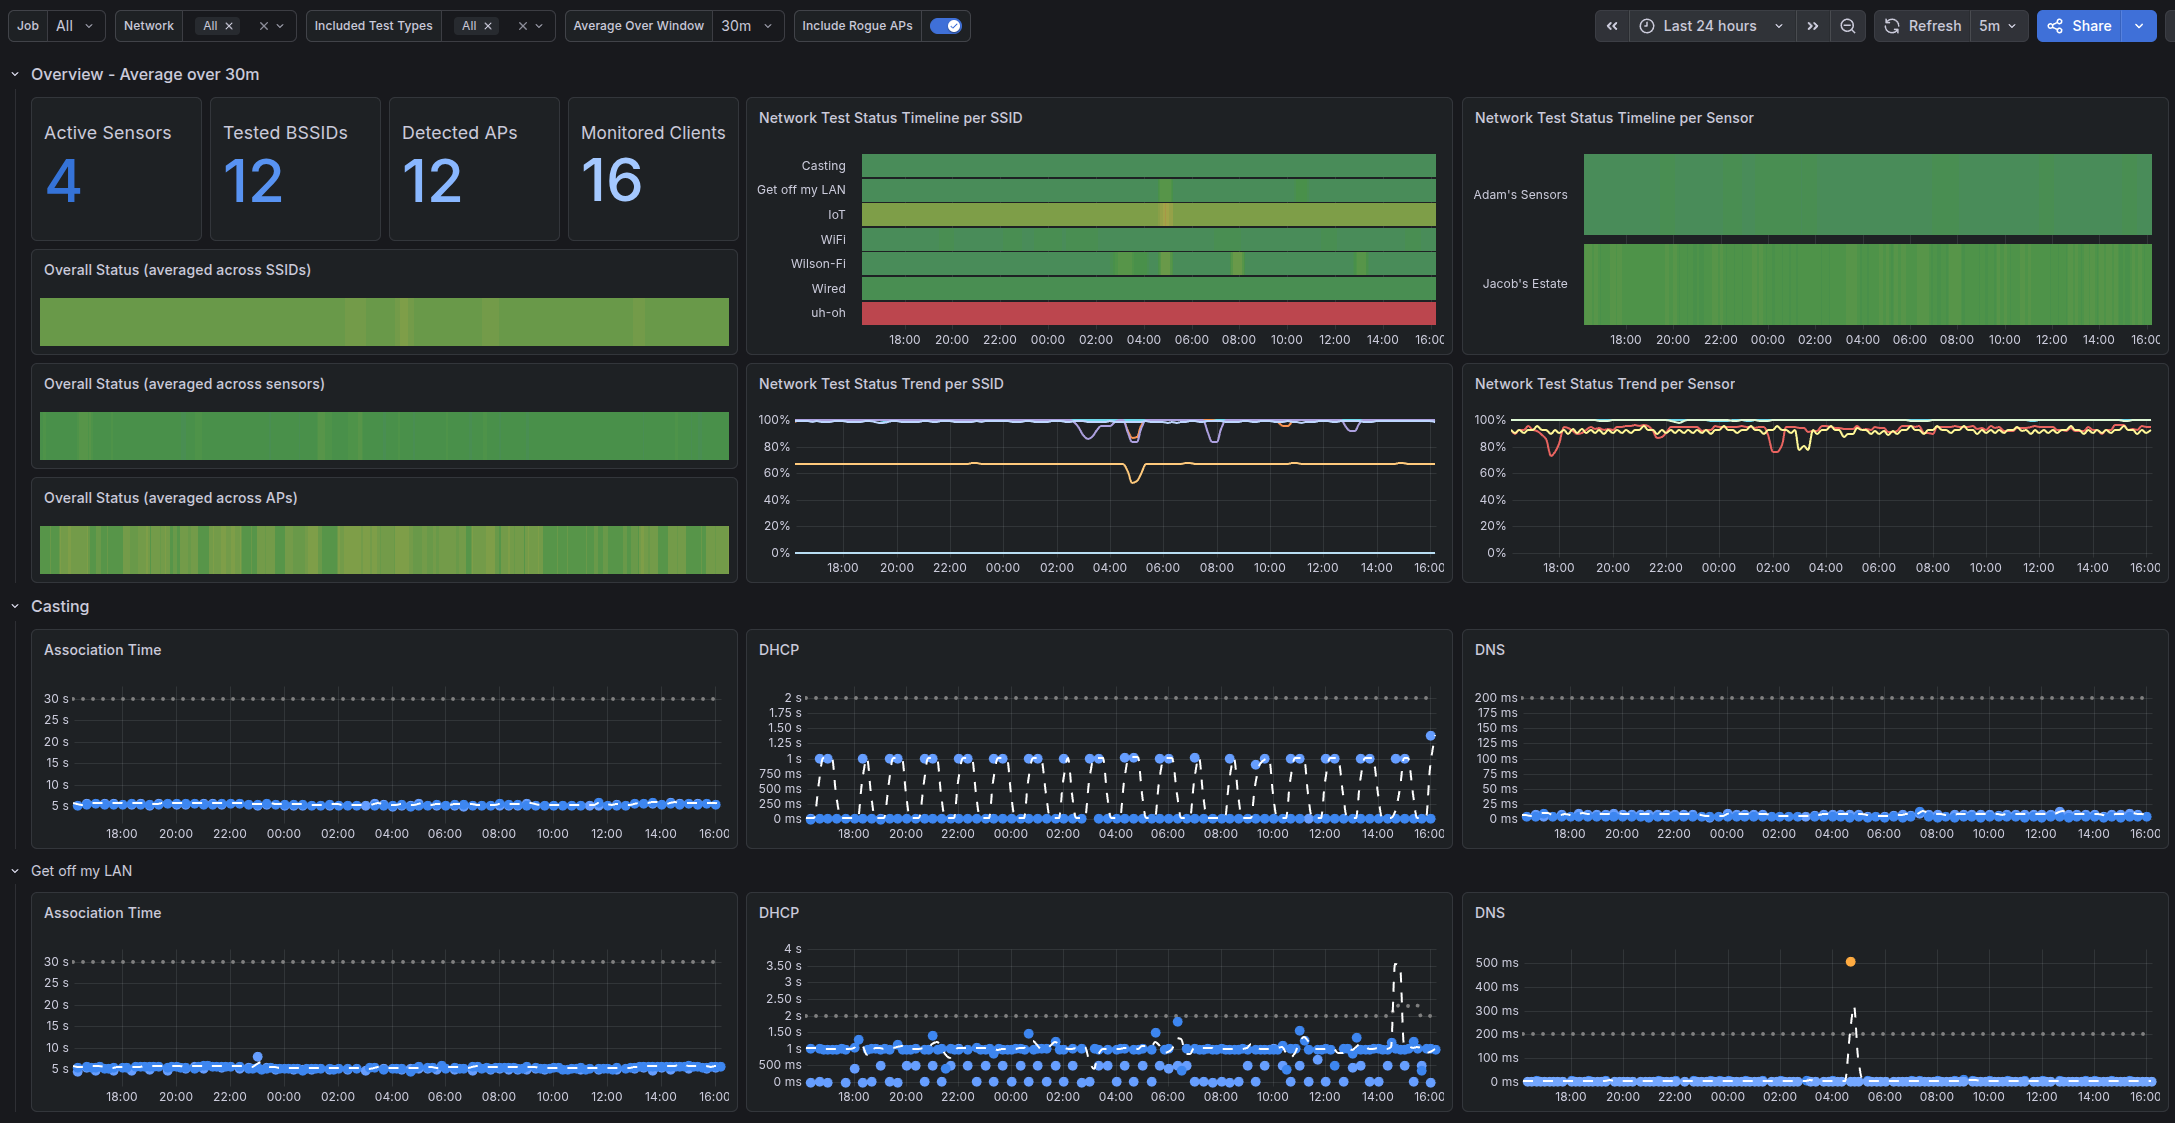
¶ Importable Grafana Dashboard Templates
For instructions on importing Grafana dashboards, see this guide: https://grafana.com/docs/grafana/latest/dashboards/build-dashboards/import-dashboards/
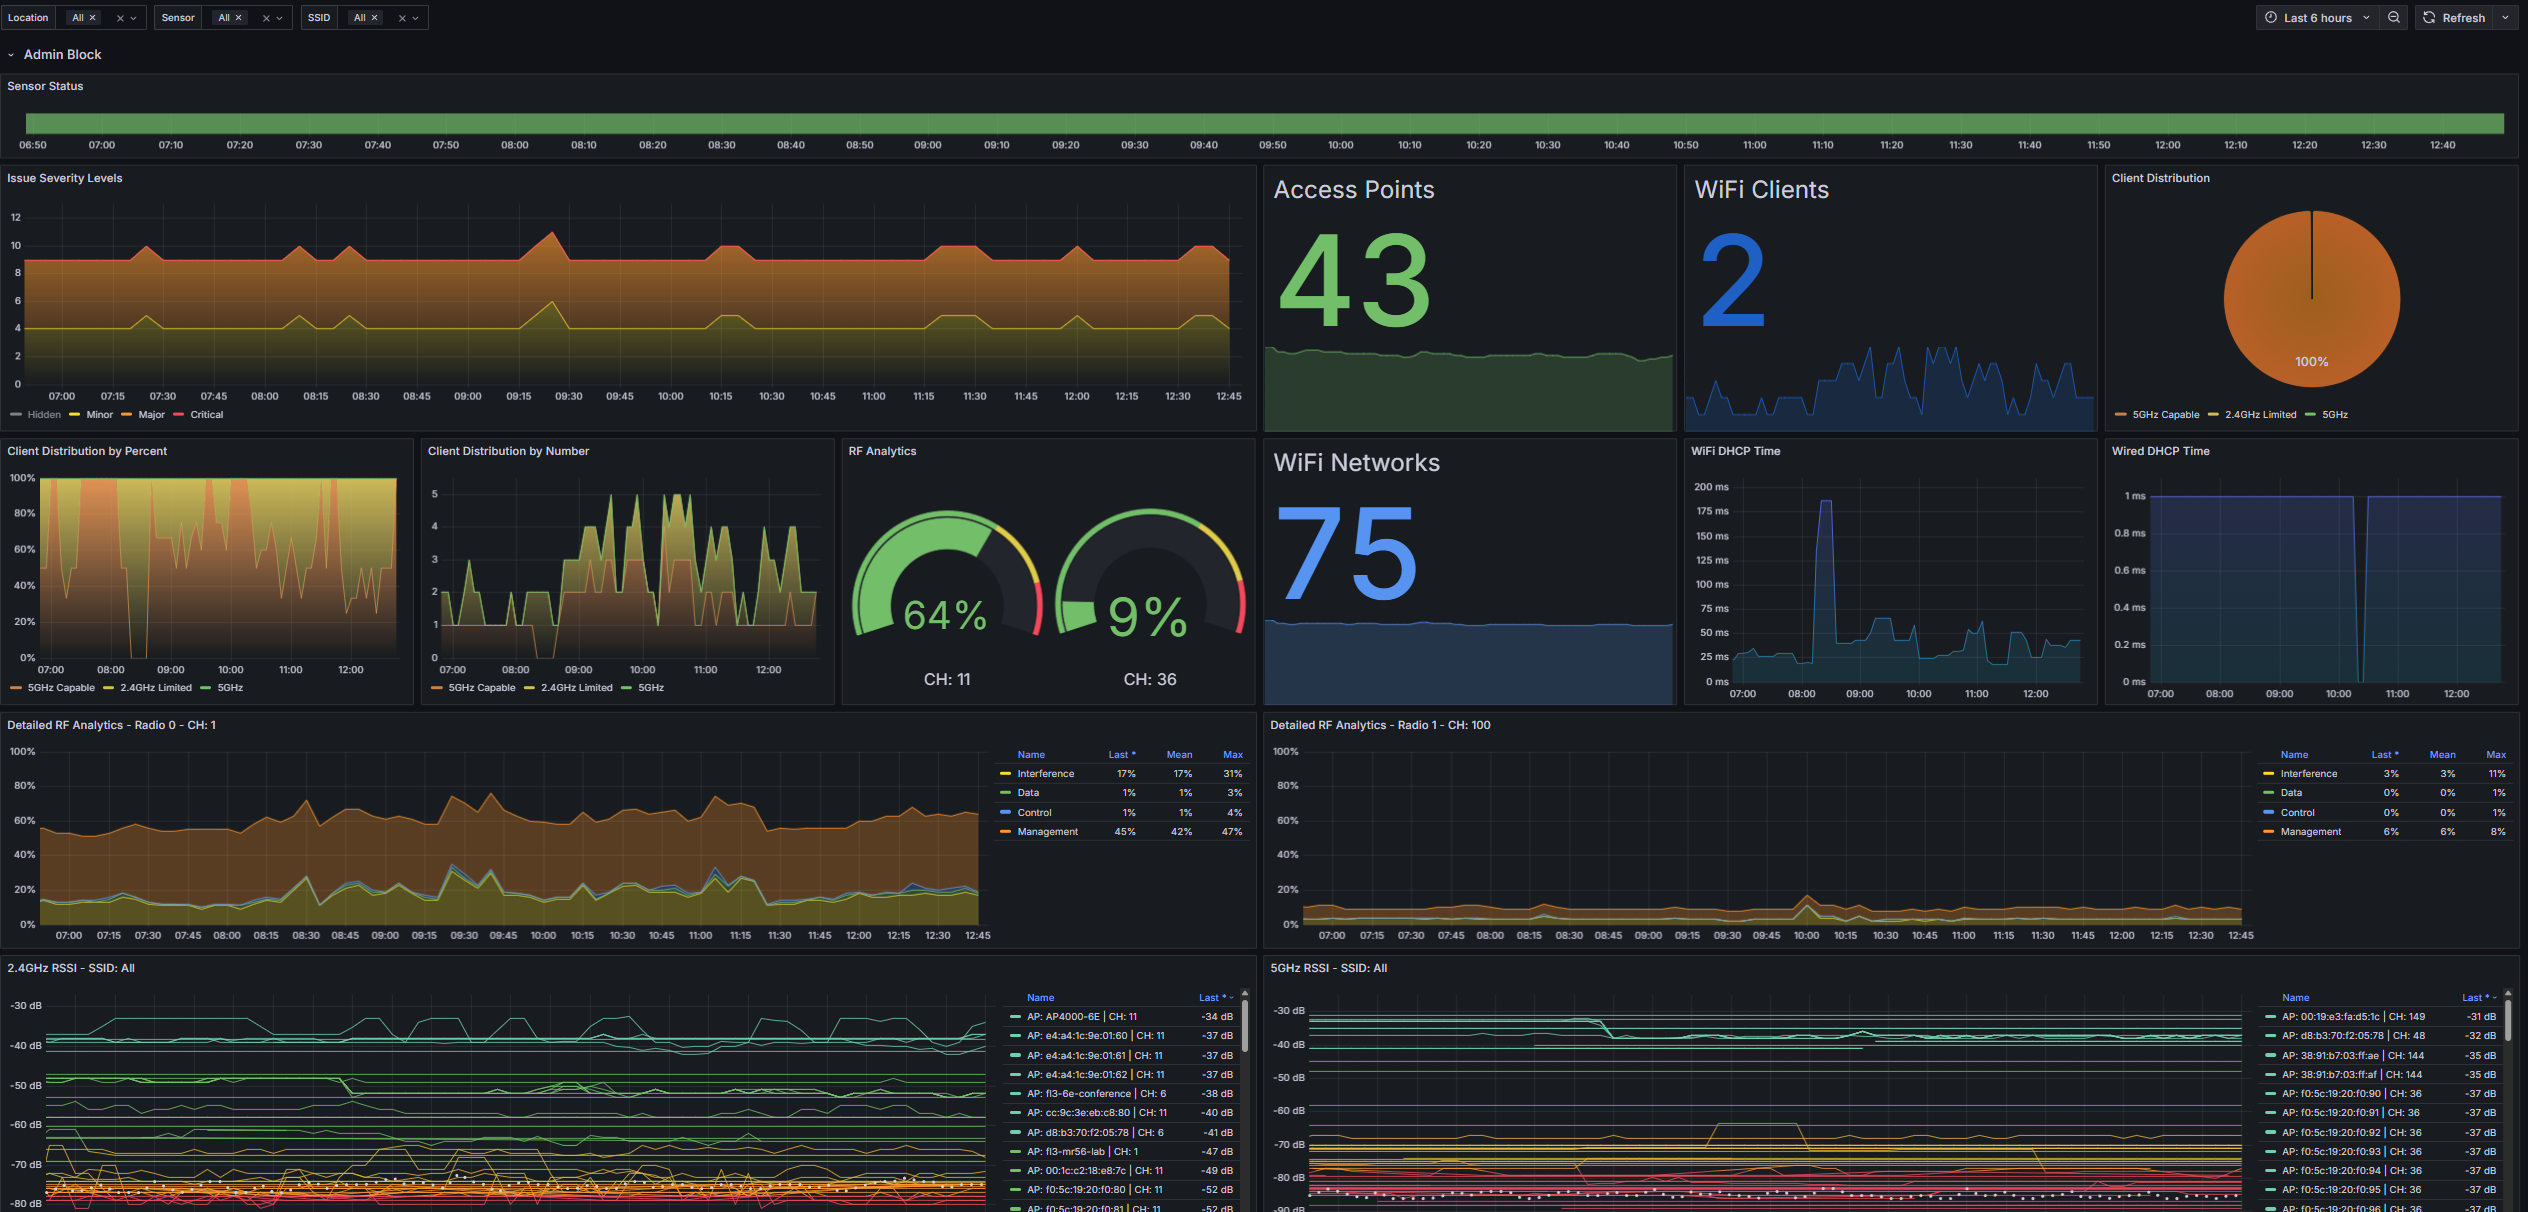
¶ Sensor Overview
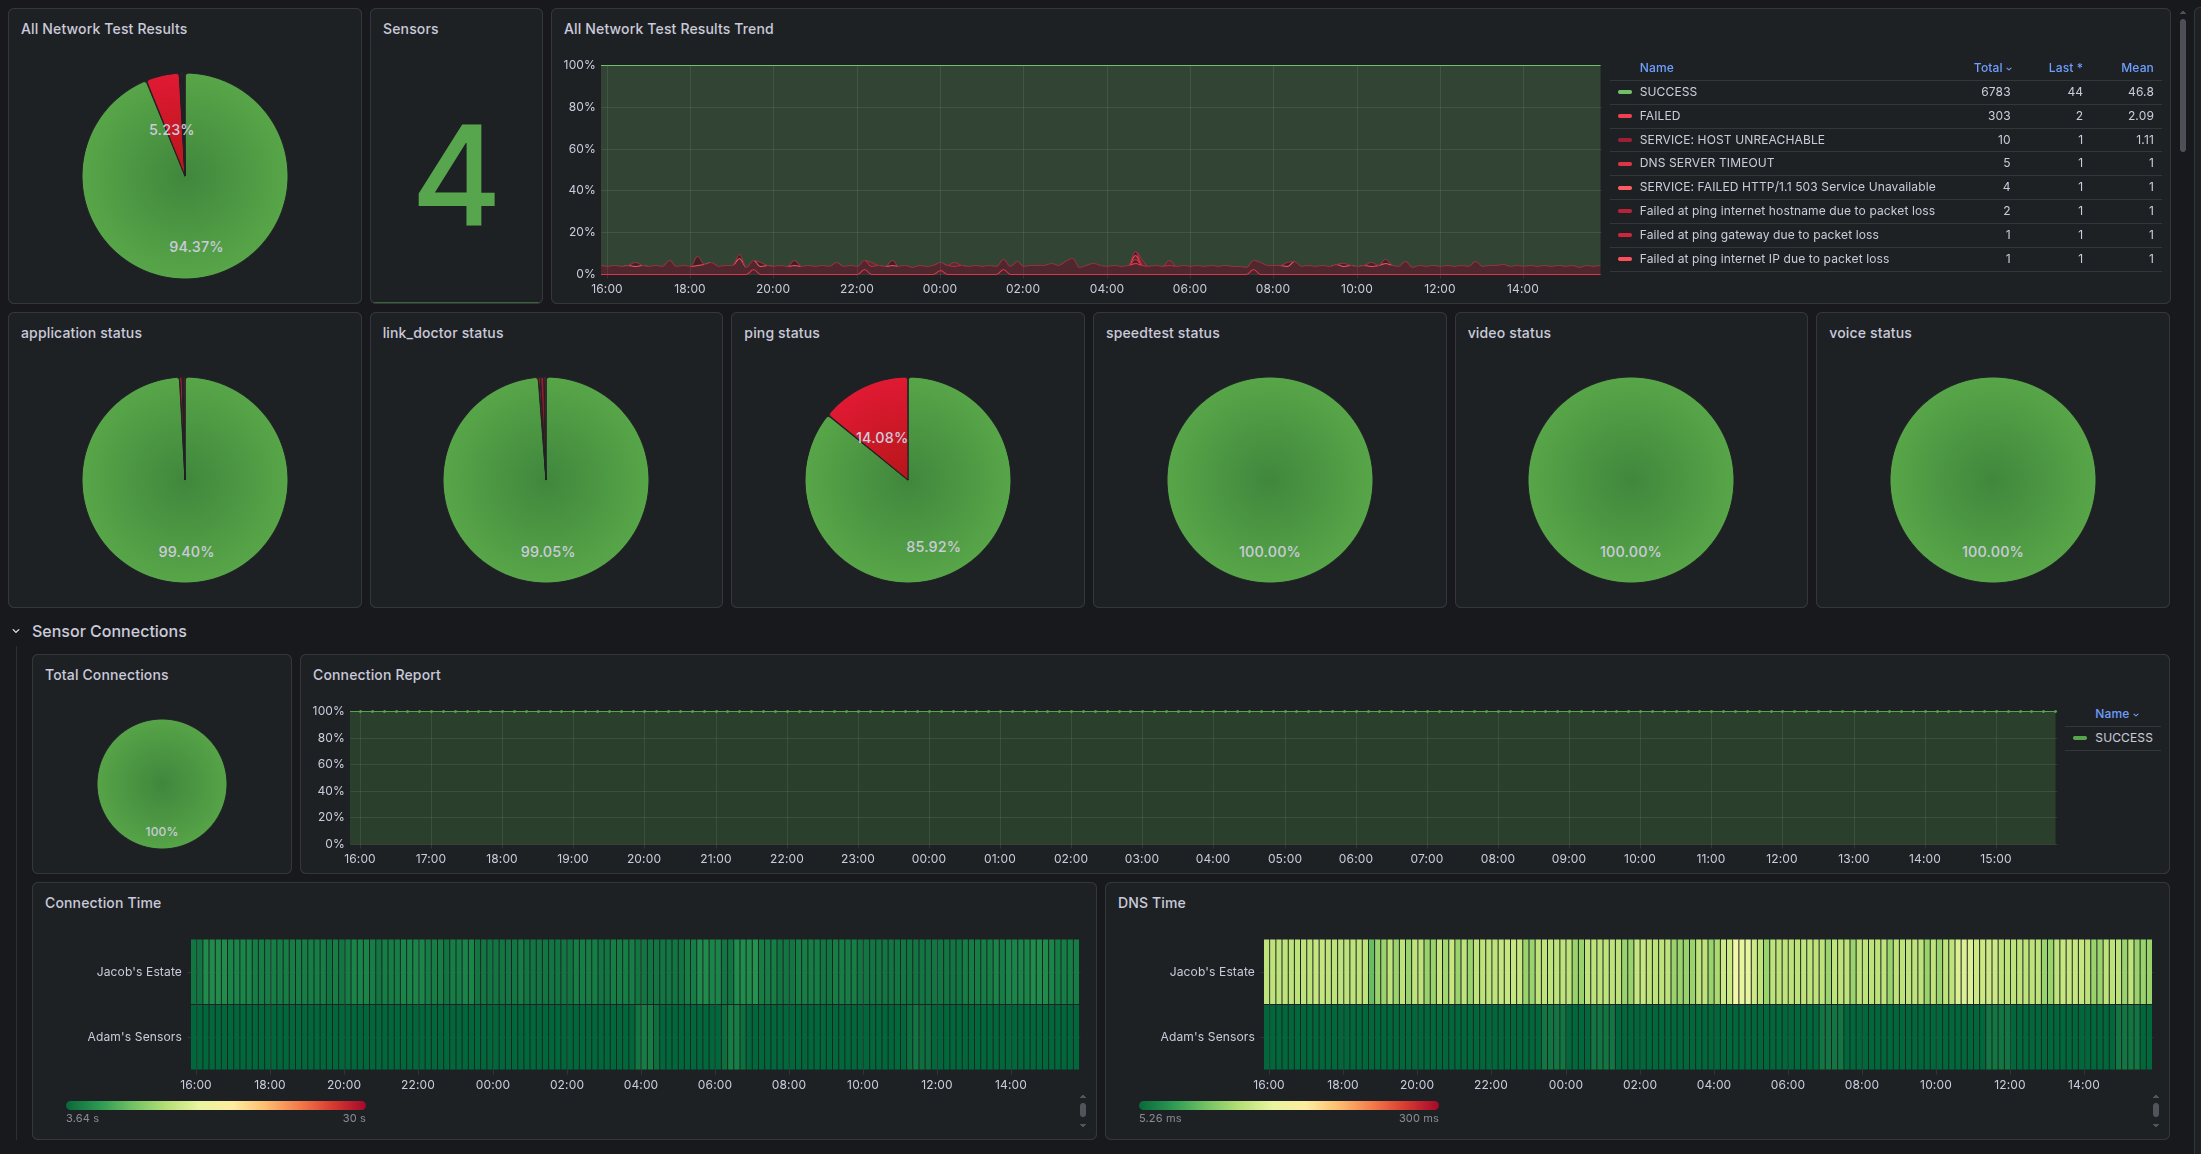
¶ Network Tests Overview
¶ Response Time Dashbaord
¶ Connection Status Dashboard
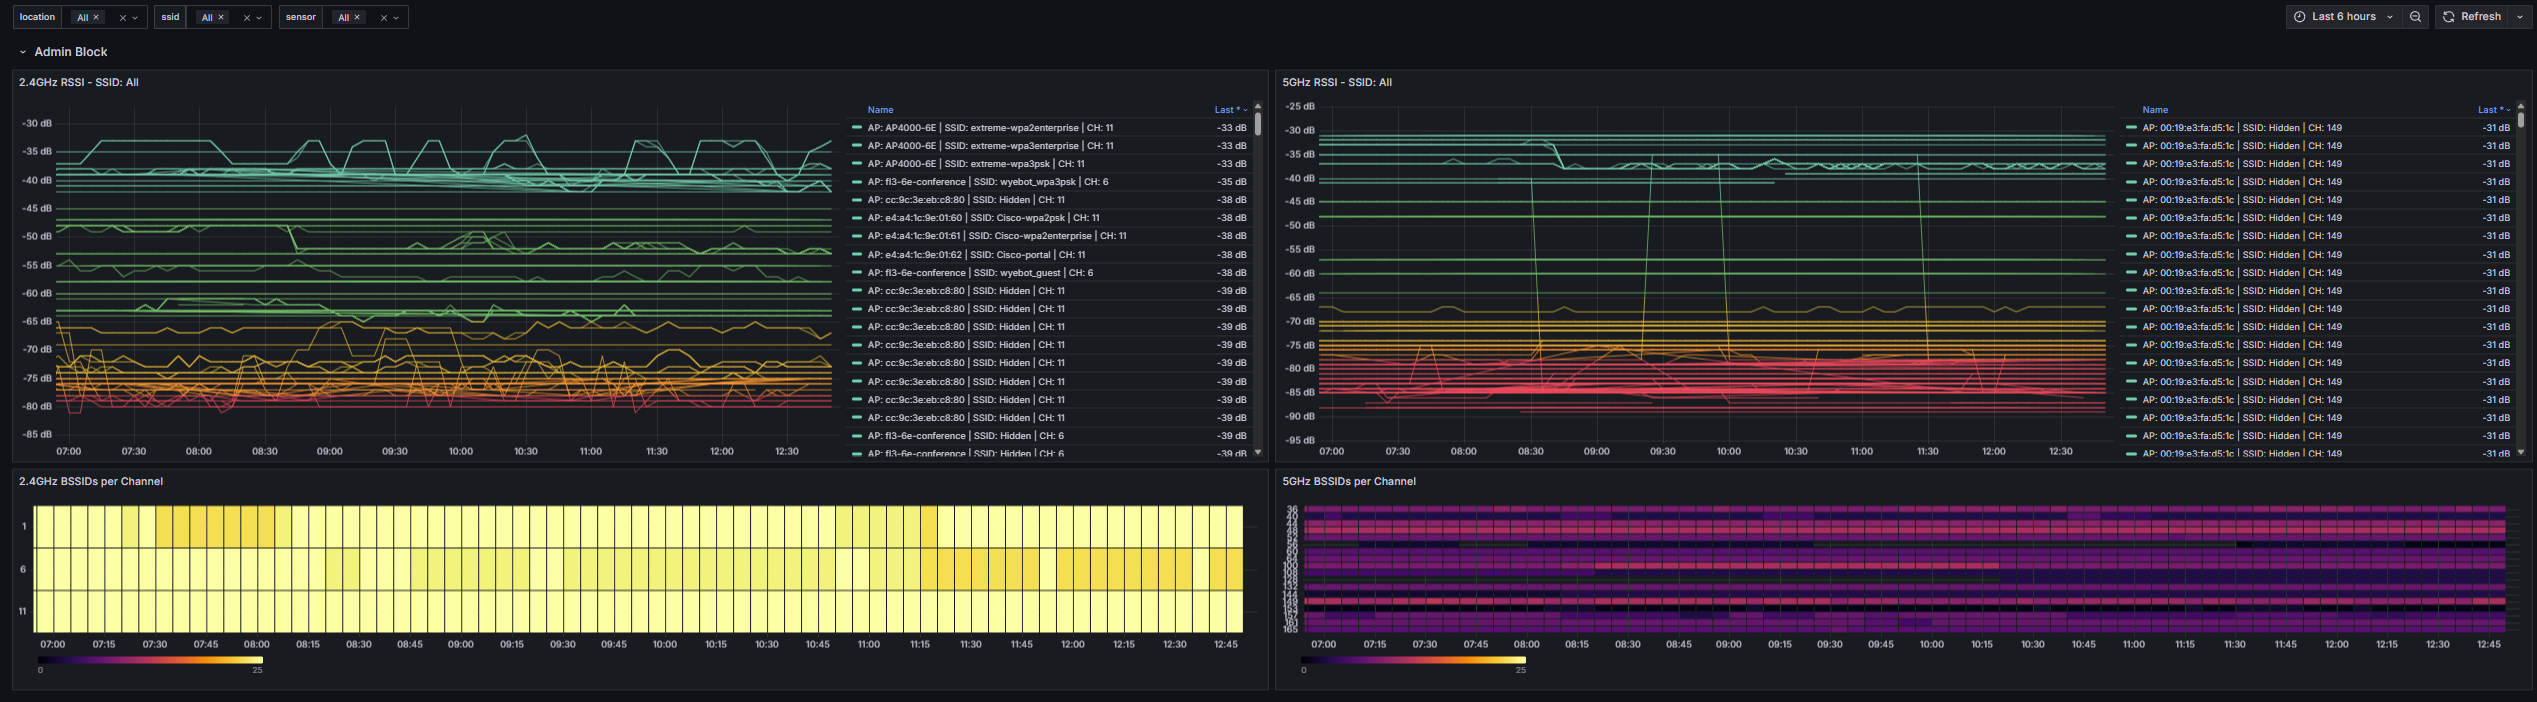
¶ SSID Inspector